This is a continuation of our Loading OpenStreetMap data in PostGIS.
In this tutorial we will build a tile cache of the Massachusetts data we loaded in Part 1 and then render it in OpenLayers.
We will be using Mapnik toolkit to do this.
Some PostGIS gotchas before we start-- that you may or may not need to address
In PostgreSQL database -- had to add these 2 columns because it was looking for it and didn't exist in my dump:
ALTER TABLE planet_osm_polygon ADD COLUMN "addr:housename" text;
ALTER TABLE planet_osm_point ADD COLUMN "addr:housename" text;
The Mapnik scripts use the PostGIS deprecated functions Extent,AsBinary, and SetSRID to name a few which were removed in PostGIS 2.0. You will
sadly need to run the legacy.sql for now to get back those functions if you are testing with PostGIS 2.0. The
legacy.sql is installed in the contrib/share/postgis-2.0 folder.
UPDATE: Mapnik trunk, aka Mapnik 2.0 with planned release in Summer 2011 no longer uses deprecated PostGIS functions and has also been revised to support Python 2.5->3.2
Getting Mapnik up
- Install Python 2.5 or 2.6 -- NOTE: MapNik to our knowledge does not currently work with newer versions of Python.
- If you are on Windows - install the HOTOSM (if you didn't already in the Loading OpenStreetMap tutorial). If you are on
another OS, refer to Mapnik installation instructions.
Note: HOTOSM users - when HOTOSM installs, it sets the PythonPath variable under Control Panel->System->Advanced -> Environment Variables to
;C:\Program Files\HOTOSM\python\2.5\site-packages. This will not work if you
are running python 2.6. Change the 2.5 to 2.6. To test your install, open a command line and cd to
cd C:\Program Files\HOTOSM\demo\python
c:\python26\python rundemo.py
If all is good, you should see a bunch of .png files generated in that folder.
Building the Tiles
You may also want to take a look at http://weait.com/content/build-your-own-openstreetmap-server
if some of what we say doesn't make sense to you.
-
Once you have Mapnik installed, you want to download the python scripts for generating OpenStreetMap tiles.
which you can get from openstreetmap subversion repository
http://svn.openstreetmap.org/applications/rendering/mapnik/
and then copy these into a folder say osm_mapnik.
For ease of use, we have exported these out of the subversion repository and made the latest
available (as of May 18th,2011) -- at http://www.bostongis.com/downloads/osm_mapnik_r26011.zip
Note: If you have an svn client you can download the folder yourself with command svn co http://svn.openstreetmap.org/applications/rendering/mapnik/.
- Next do the following at a command prompt: NOTE to windows users -- if you don't have wget or tar tools, you can manually download
these files and put them in your osm_mapnik folder and extract them with 7-zip into folder world_boundaries
cd osm_mapnik #this is the folder you extracted the scripts
wget http://tile.openstreetmap.org/world_boundaries-spherical.tgz
tar xvzf world_boundaries-spherical.tgz
wget http://tile.openstreetmap.org/processed_p.tar.bz2
tar xvjf processed_p.tar.bz2 -C world_boundaries
wget http://tile.openstreetmap.org/shoreline_300.tar.bz2
tar xjf shoreline_300.tar.bz2 -C world_boundaries
wget http://www.naturalearthdata.com/http//www.naturalearthdata.com/download/110m/cultural/110m-admin-0-boundary-lines.zip
unzip 110m-admin-0-boundary-lines.zip -d world_boundaries
wget http://www.naturalearthdata.com/http//www.naturalearthdata.com/download/10m/cultural/10m-populated-places.zip
unzip 10m-populated-places.zip -d world_boundaries
Figure out extent to build for
Before we begin, we need to figure out the extent of our tiles. We do that with this SQL Statement (sadly there is data in the osm ma dataset that far exceeds the extents of Massachusetts),
so I opted to use a US states table I had lying around instead of ST_Extent of any of the osm tables:
SELECT ST_Extent(the_geom) As wgs_84, ST_Extent(ST_Transform(the_geom,900913)) as web_merc
FROM tiger.states WHERE stusps = 'MA';
BOX(-73.508142 41.187053,-69.858861 42.88679) --wgs_84
BOX(-8182888.93659964 5011826.70961612,-7776652.83391808 5265667.90278576) --web_merc
Generate the osm styling xml and prepare tile directory
A little bit about the osm.xml. This file contains all the styling rules for generating the tiles and serves as a template for building your final styling .xml. It defines the icons to
use, how to draw the lines and so forth. If you are not happy with the default mapnik styling and want to highlight certain features differently,
you can manually edit this xml file and resave it under say osm_custom.xml before you start to build you run the generate_xml.py and use that where we are using osm.xml.
Note: If you are on windows and want to put the files in non C drive -- do a mkdir D:/osm_tiles or whatever folder you want
mkdir /osm_tiles
generate_xml.py osm.xml /osm_tiles/ma_osm.xml --dbname osm --user postgres --port 5432  --extent -8182889,5011827,-7776653,5265668 --accept-none
Test rendering
Next we edit the generate_image.py file and change the ll to -73.508142,41.187053,-69.858861,42.88679 and then at command line:
generate_image.py
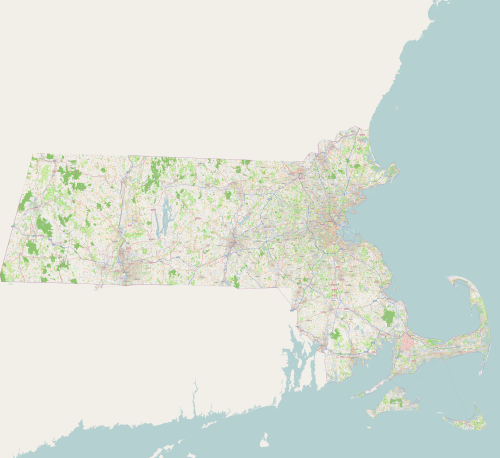
Confirm that the image.png generated looks like Massachusetts. It will be very high-res around 8 MB and look something like:
Generate Massachusetts Tiles
Next resave the generate_tiles.py as generate_tiles_ma.py. Edit generate_times_ma.py and the render_tiles section way at the bottom,change to:
	bbox = (-73.508142,41.187053,-69.858861,42.88679)
    render_tiles(bbox, mapfile, tile_dir, 6, 8, "Massachusetts")

    minZoom = 10
    maxZoom = 17
    bbox = (-73.508142,41.187053,-69.858861,42.88679)
    render_tiles(bbox, mapfile, tile_dir, minZoom, maxZoom)
Windows commands
set MAPNIK_MAP_FILE=/osm_tiles/ma_osm.xml
set MAPNIK_TILE_DIR=/osm_tiles
set HOME=/osm_tiles
generate_tiles_ma.py
If you just want to generate for Boston
-
Resave generate_tiles.py as generate_tiles_boston.py and change the tiles section to:
	bbox = (-71.2,42.23,-70.99, 42.4)
render_tiles(bbox, mapfile, tile_dir, 10, 17, "Boston")
-
set MAPNIK_MAP_FILE=/osm_boston_tiles/ma_osm.xml
set MAPNIK_TILE_DIR=/osm_boston_tiles
set HOME=/osm_boston_tiles
generate_tiles_boston.py
In Part 3 of our series, we will show you how to use your own custom tiles in OpenLayers.
Post Comments About Part 2: Building Tiles with PostGIS OpenStreetMap data and Mapnik: Your Own OpenStreetMap

